
- Matplotlib是Python中最常用的可视化工具之一,可以非常方便地创建海量类型的2D图表和一些基本的3D图表,可根据数据集(DataFrame,Series)自行定义x,y轴,绘制图形(线形图,柱状图,直方图,密度图,散布图等等),能够满足大部分需要。
- Matplotlib最早是为了可视化癫痫病人的脑皮层电图相关的信号而研发,因为在函数的设计上参考了MATLAB,所以叫做Matplotlib。
- 官方文档: https://matplotlib.org/
- Matplotlib中最基础的模块是pyplot。

安装
pip install matplotlib
import numpy as np
import matplotlib.pyplot as plt
# 将绘图直接嵌入到notebook中,直接显示图片,不用.show()
%matplotlib inline
# 折线图
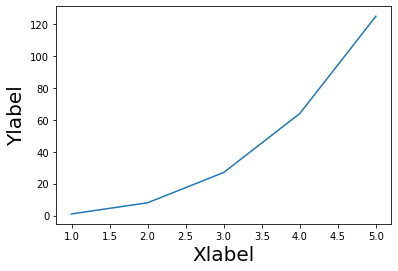
plt.plot([1,2,3,4,5],[1,8,27,64,125])
plt.xlabel('Xlabel',fontsize=20)
plt.ylabel('Ylabel',fontsize=20)
# 不同的线条
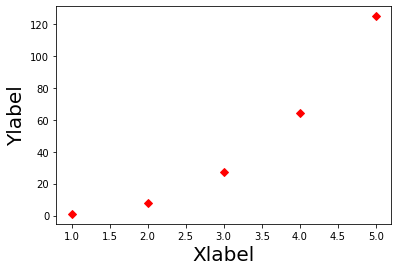
plt.plot([1,2,3,4,5],[1,8,27,64,125],'D',color='r')
plt.xlabel('Xlabel',fontsize=20)
plt.ylabel('Ylabel',fontsize=20)
Markers
=============   ===============================
character       description
=============   ===============================
``'.'``         point marker
``','``         pixel marker
``'o'``         circle marker
``'v'``         triangle_down marker
``'^'``         triangle_up marker
``'<'``         triangle_left marker
``'>'``         triangle_right marker
``'1'``         tri_down marker
``'2'``         tri_up marker
``'3'``         tri_left marker
``'4'``         tri_right marker
``'8'``         octagon marker
``'s'``         square marker
``'p'``         pentagon marker
``'P'``         plus (filled) marker
``'*'``         star marker
``'h'``         hexagon1 marker
``'H'``         hexagon2 marker
``'+'``         plus marker
``'x'``         x marker
``'X'``         x (filled) marker
``'D'``         diamond marker
``'d'``         thin_diamond marker
``'|'``         vline marker
``'_'``         hline marker
=============   ===============================

**Line Styles**

=============    ===============================
character        description
=============    ===============================
``'-'``          solid line style
``'--'``         dashed line style
``'-.'``         dash-dot line style
``':'``          dotted line style
=============    ===============================

Example format strings::

    'b'    # blue markers with default shape
    'or'   # red circles
    '-g'   # green solid line
    '--'   # dashed line with default color
    '^k:'  # black triangle_up markers connected by a dotted line

**Colors**

The supported color abbreviations are the single letter codes

=============    ===============================
character        color
=============    ===============================
``'b'``          blue
``'g'``          green
``'r'``          red
``'c'``          cyan
``'m'``          magenta
``'y'``          yellow
``'k'``          black
``'w'``          white
=============    ===============================
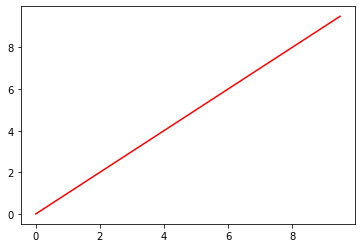
tang_numpy = np.arange(0,10,0.5)
tang_numpy
array([0. , 0.5, 1. , 1.5, 2. , 2.5, 3. , 3.5, 4. , 4.5, 5. , 5.5, 6. ,
       6.5, 7. , 7.5, 8. , 8.5, 9. , 9.5])
plt.plot(tang_numpy,tang_numpy,'r')
# 多条线
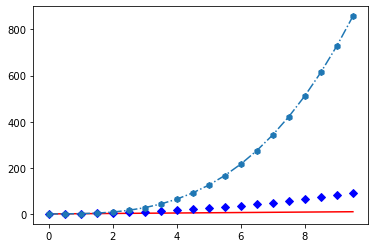
plt.plot(tang_numpy,tang_numpy,'r',
         tang_numpy,tang_numpy**2,'bD',
         tang_numpy,tang_numpy**3,'h-.')
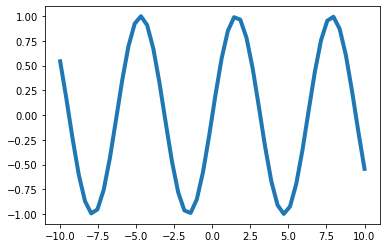
# 指定线条宽度
x = np.linspace(-10,10)
y = np.sin(x)
plt.plot(x,y,linewidth=4.0)
# 指定多个参数
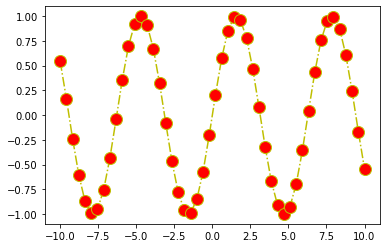
plt.plot(x,y,color='y',linestyle='-.',marker='o',markerfacecolor='r',markersize=12)
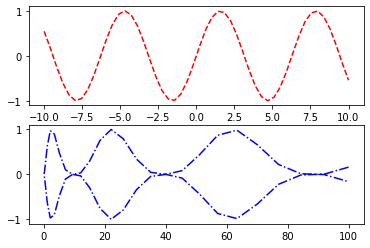
# 子图 211 两行一列1图
plt.subplot(211)
plt.plot(x,y,"r--")
# 212 两行一列 2 图
plt.subplot(212)
plt.plot(x**2,y**3,"b-.")
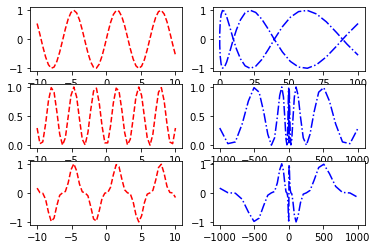
plt.subplot(321)
plt.plot(x,y,"r--")
plt.subplot(322)
plt.plot(x**2,y,"b-.")
plt.subplot(323)
plt.plot(x,y**2,"r--")
plt.subplot(324)
plt.plot(x**3,y**2,"b-.")
plt.subplot(325)
plt.plot(x,y**3,"r--")
plt.subplot(326)
plt.plot(x**3,y**3,"b-.")
# 备注
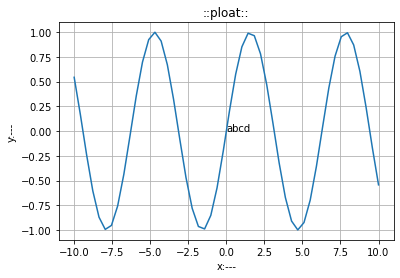
plt.plot(x,y)
plt.xlabel('x:---')
plt.ylabel('y:---')
plt.title('::ploat::')
plt.text(0,0,'abcd')
# 格子
plt.grid(True)
使用与配置
创建空白画布
plt.figure  创建空白画布,指定画布大小,像素

plt.figure(num=None,  # autoincrement if None, else integer from 1-N
           figsize=None,  # defaults to rc figure.figsize
           dpi=None,  # defaults to rc figure.dpi
           facecolor=None,  # defaults to rc figure.facecolor
           edgecolor=None,  # defaults to rc figure.edgecolor
           frameon=True,
           FigureClass=Figure,
           clear=False,
           **kwargs)

figure.add_subplot  创建子图,指定子图的行数、列数
add_subplot(nrows, ncols, index, **kwargs)
配置方法
| 函数名称 | 函数作用 |
|---|---|
| plt.title | 当前图像标题,可以指定标题名称,颜色,位置,字体大小等参数 |
| plt.xlabel | 当前图形中X轴的名称,颜色,位置,字体大小等参数 |
| plt.ylabel | 当前图形中Y轴的名称,颜色,位置,字体大小等参数 |
| plt.xlim | 指定当前图形X轴的范围,只能确定一个数值区间,无法使用字符串标识。 |
| plt.ylim | 指定当前图形Y轴的范围,只能确定一个数值区间,无法使用字符串标识。 |
| plt.xticks | 指定当前图形X轴的刻度与取值 |
| plt.yticks | 指定当前图形Y轴的刻度与取值 |
| plt.legend | 指定当前图形的图例,可以指定图形的大小、位置、标签 |
使用plt.plot绘图
'''
plt.plot(x,y,format_string,**kwargs)
x 轴数据
y 轴数据
fromat_string 控制曲线的格式化字符
'''
| 颜色字符 | 说明 | 颜色字符 | 说明 |
|---|---|---|---|
| ‘b’ | 蓝色 | ‘m’ | 洋红色 |
| ‘g’ | 绿色 | ‘k’ | 黑色 |
| ‘r’ | 红色 | ’y' | 黄色 |
| ’c’ | 青绿色 | ‘w’ | 白色 |
| #001234 | RGB某颜色 | ’0.7‘ | 灰度值字符串 |
| 样式风格字符 | 说明 | 样式风格字符 | 说明 | 样式风格字符 | 说明 |
|---|---|---|---|---|---|
| ’-‘ | 实线 | ’.‘ | 点标记 | ’>‘ | 右三角 |
| ’__‘ | 破折线 | ’o‘ | 实心圆 | ’s‘ | 实方形 |
| ’-.‘ | 点划线 | ’v‘ | 倒三角 | ’p‘ | 实五角 |
| ‘:’ | 虚线 | ’^‘ | 上三角 | ’+‘ | 十字标记 |
| ’,‘ | 像素线 | ‘<’ | 左三角 | ’x‘ | x标记 |
| ’D‘ | 菱形 | ’*‘ | 星形 | ’|‘ | 垂直线 |
保存图片
plt.saveflg()  保存图形,执行图片分辨率、边缘颜色
plt.show()  显示图形
案例一
import numpy as np
import matplotlib.pylab as plt

%matplotlib inline

# 案例1

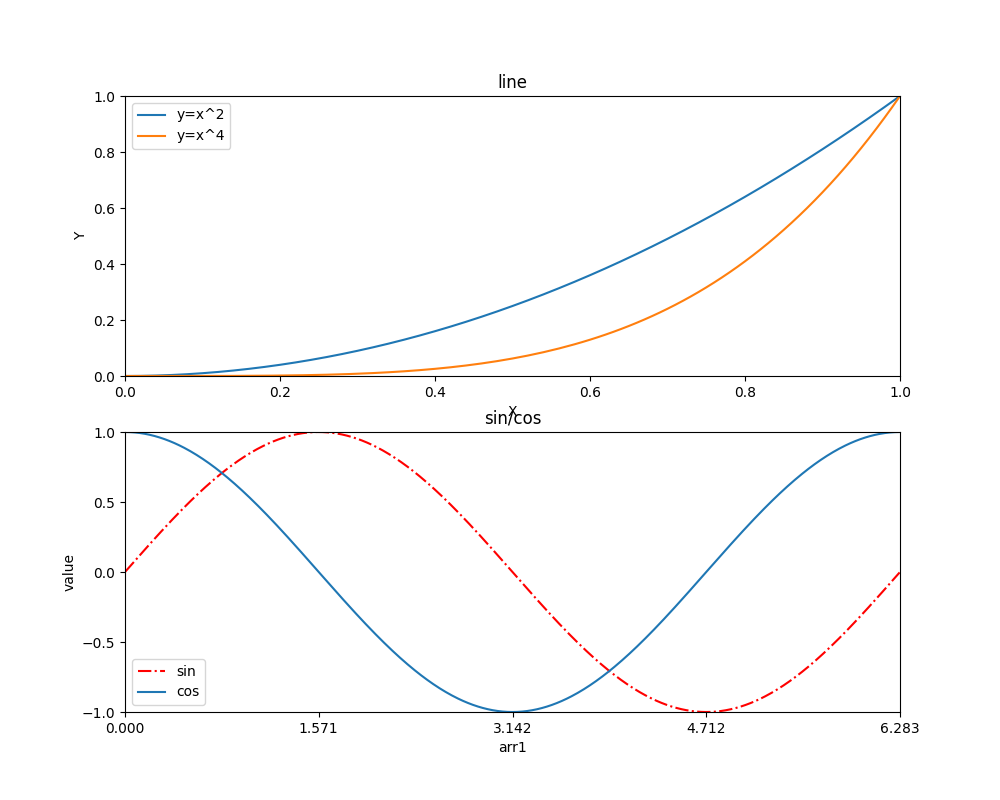
arr1 = np.arange(0, np.pi * 2, 0.01)

# 确定画图大小
p1 = plt.figure(figsize=(10, 8), dpi=100)

# 创建子图 2行1列
sp1 = p1.add_subplot(2, 1, 1)

# 添加标题
plt.title('line')

# 指定x轴名称
plt.xlabel('X')

# 指定Y轴名称
plt.ylabel('Y')

# X刻度范围
plt.xlim((0, 1))

# Y刻度范围
plt.ylim((0, 1))

# 规定X轴刻度
plt.xticks(np.linspace(0, 1, num=6))

# 规定Y轴刻度
plt.yticks(np.linspace(0, 1, num=6))

# 添加 y = x ^ 2
plt.plot(arr1, arr1 ** 2)

# 添加 y = x ^ 4
plt.plot(arr1, arr1 ** 4)

# 线段显示名称
plt.legend(['y=x^2', 'y=x^4'])

# 创建第二幅图
sp2 = p1.add_subplot(2, 1, 2)

# 添加标题
plt.title('sin/cos')

# 指定x轴名称
plt.xlabel('arr1')

# 指定Y轴名称
plt.ylabel('value')

# X刻度范围
plt.xlim((0, np.pi * 2))

# Y刻度范围
plt.ylim((-1, 1))

# 规定X轴刻度
plt.xticks([0, np.pi / 2, np.pi, np.pi * 1.5, np.pi * 2])

# 规定Y轴刻度
plt.yticks([-1, -0.5, 0, 0.5, 1])

# 添加 y = np.sin(arr1)
plt.plot(arr1, np.sin(arr1),'r-.')

# 添加 y = np.cos(arr1)
plt.plot(arr1, np.cos(arr1),)

# 线段显示名称
plt.legend(['sin', 'cos'])

# 显示图形
plt.show()

# 保存图形
# plt.savefig('sincos.png')
修改图形的样式
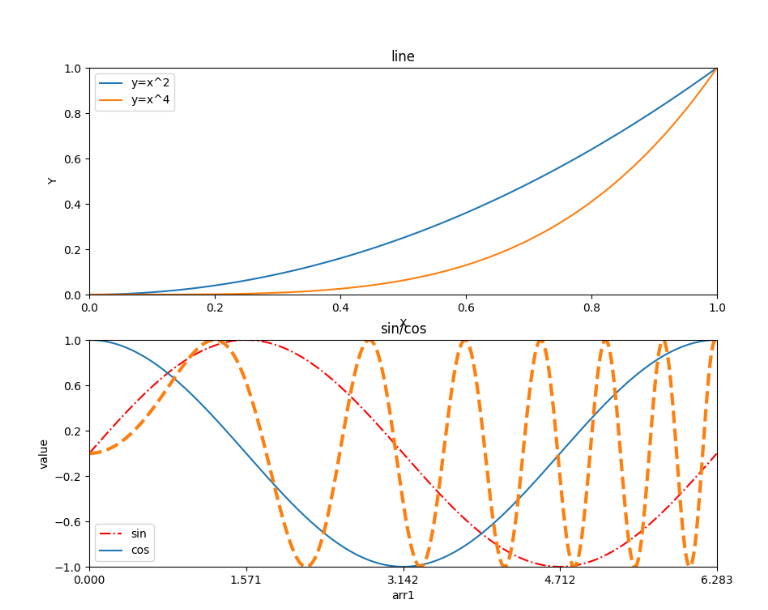
plt.rcParams['lines.linestyle'] = '--'
plt.rcParams['lines.linewidth'] = 3
plt.plot(arr1, np.sin(arr1 ** 2))
plt.show()
设置中文显示
由于默认的pyplot字体并不支持中文字符的显示,因此需要通过设置font.sans-serif参数改变绘图时的字体,使得图形可以正常显示中文。同时,由于更改字体后,会导致坐标轴中的部分字符无法显示,因此需要同时更改axes.unicode_minus参数。
plt.rcParams['font.sans-serif'] = 'SimHei'  # 设置中文显示
plt.rcParams['axes.unicode_minus'] = False
除了设置线条和字体的rc参数外,还有设置文本、箱线图、坐标轴、刻度、图例、标记、图片、图像保存等rc参数。具体参数与取值可以参考官方文档。
No module named 'PIL'错误
# 如果遇到如下错误
ModuleNotFoundError: No module named 'PIL'

# 解决方法:运行卸载命令:
pip uninstall pillow

# 然后再次运行安装命令:
pip install pillow