import numpy as np
import matplotlib.pyplot as plt
将一个数组拆分成几个较小的数组
使用hsplit,您可以通过指定要返回的形状相同的数组的数量,或指定应在其后进行除法的列,沿其水平轴拆分数组
rg = np.random.default_rng(1)
a = np.floor(10 * rg.random((2,12)))
a
array([[5., 9., 1., 9., 3., 4., 8., 4., 5., 0., 7., 5.],
       [3., 7., 3., 4., 1., 4., 2., 2., 7., 2., 4., 9.]])
# 将a数组拆分成三份
np.hsplit(a,3)
[array([[5., 9., 1., 9.],
        [3., 7., 3., 4.]]),
 array([[3., 4., 8., 4.],
        [1., 4., 2., 2.]]),
 array([[5., 0., 7., 5.],
        [7., 2., 4., 9.]])]
# 在3列表、6列、9列分割
np.hsplit(a,(3,6,9))
[array([[5., 9., 1.],
        [3., 7., 3.]]),
 array([[9., 3., 4.],
        [4., 1., 4.]]),
 array([[8., 4., 5.],
        [2., 2., 7.]]),
 array([[0., 7., 5.],
        [2., 4., 9.]])]
副本和视图
在操作和操作数组时,它们的数据有时会复制到新数组中,有时不会。这通常是初学者困惑的根源。有以下三种情况: 1. 没有复制 2. 视图或浅拷贝 3. 深拷贝
# 简单赋值不会复制对象或其数据。
a = np.arange(12)
a.reshape(3,4)
array([[ 0,  1,  2,  3],
       [ 4,  5,  6,  7],
       [ 8,  9, 10, 11]])
b = a
b is a
True
# 浅拷贝或视图
# 不同的数组对象可以共享相同的数据。该view方法创建一个查看相同数据的新数组对象。
c = a.view()
c is a
False
c.base is a
True
c
array([ 0, 1, 2, 3, 4, 5, 6, 7, 8, 9, 10, 11])
c[3] = 100
a
array([ 0, 1, 2, 100, 4, 5, 6, 7, 8, 9, 10, 11])
# 深拷贝
# 该copy方法制作数组及其数据的完整副本。
d = a.copy()
a[3] = 200
a
array([ 0, 1, 2, 200, 4, 5, 6, 7, 8, 9, 10, 11])
d
array([ 0, 1, 2, 100, 4, 5, 6, 7, 8, 9, 10, 11])
# copy如果不再需要原始数组,有时应该在切片后调用。
a = np.arange(int(1e8))
b = a[:100].copy()
del a
b
array([ 0,  1,  2,  3,  4,  5,  6,  7,  8,  9, 10, 11, 12, 13, 14, 15, 16,
       17, 18, 19, 20, 21, 22, 23, 24, 25, 26, 27, 28, 29, 30, 31, 32, 33,
       34, 35, 36, 37, 38, 39, 40, 41, 42, 43, 44, 45, 46, 47, 48, 49, 50,
       51, 52, 53, 54, 55, 56, 57, 58, 59, 60, 61, 62, 63, 64, 65, 66, 67,
       68, 69, 70, 71, 72, 73, 74, 75, 76, 77, 78, 79, 80, 81, 82, 83, 84,
       85, 86, 87, 88, 89, 90, 91, 92, 93, 94, 95, 96, 97, 98, 99])
广播规则
广播允许通用函数以有意义的方式处理不具有完全相同形状的输入。
广播的第一条规则是,如果所有输入数组的维数不相同,则会在较小数组的形状前重复添加“1”,直到所有数组的维数相同。
广播的第二条规则确保沿特定维度大小为 1 的数组的行为就像它们具有沿该维度具有最大形状的数组的大小一样。假设数组元素的值沿“广播”数组的维度相同。
应用广播规则后,所有数组的大小必须匹配。更多细节可以在广播中找到。
高级索引和索引技巧
除了通过整数和切片索引,正如我们之前看到的,数组可以通过整数数组和布尔数组索引。
a = np.arange(12) ** 2
a
array([ 0, 1, 4, 9, 16, 25, 36, 49, 64, 81, 100, 121])
# 将一个数组作为另一个数组的下标
i = np.array([1,3,5,7])
a[i]
array([ 1, 9, 25, 49])
j = np.array([[3,4],[9,7]])
a[j]
array([[ 9, 16],
       [81, 49]])
# 当索引数组a是多维时,单个索引数组指的是 的第一维a。以下示例通过使用调色板将标签图像转换为彩色图像来展示此行为。
palette = np.array([[0, 0, 0],         # black
                    [255, 0, 0],       # red
                    [0, 255, 0],       # green
                    [0, 0, 255],       # blue
                    [255, 255, 255]])  # white

image = np.array([[0,1,2,0],[0,3,4,0]])
palette[image]
array([[[  0,   0,   0],
        [255,   0,   0],
        [  0, 255,   0],
        [  0,   0,   0]],

       [[  0,   0,   0],
        [  0,   0, 255],
        [255, 255, 255],
        [  0,   0,   0]]])
# 我们还可以为多个维度提供索引。每个维度的索引数组必须具有相同的形状。
a = np.arange(12).reshape(3, 4)
a
array([[ 0,  1,  2,  3],
       [ 4,  5,  6,  7],
       [ 8,  9, 10, 11]])
i = np.array([[0,1],[1,2]])
j = np.array([[2,1],[3,3]])
a[i,j]
array([[ 2,  5],
       [ 7, 11]])
a[i,2]
array([[ 2,  6],
       [ 6, 10]])
a[:,j]
array([[[ 2,  1],
        [ 3,  3]],

       [[ 6,  5],
        [ 7,  7]],

       [[10,  9],
        [11, 11]]])
l = (i,j)
l
(array([[0, 1],
        [1, 2]]),
 array([[2, 1],
        [3, 3]]))
a[l]
array([[ 2,  5],
       [ 7, 11]])
s = np.array([i,j])
s
array([[[0, 1],
        [1, 2]],

       [[2, 1],
        [3, 3]]])
a[tuple(s)]
array([[ 2,  5],
       [ 7, 11]])
# 数组索引的另一个常见用途是搜索时间相关序列的最大值:
time = np.linspace(20,145,5)
time
array([ 20. , 51.25, 82.5 , 113.75, 145. ])
data = np.sin(np.arange(20)).reshape(5,4)
data
array([[ 0.        ,  0.84147098,  0.90929743,  0.14112001],
       [-0.7568025 , -0.95892427, -0.2794155 ,  0.6569866 ],
       [ 0.98935825,  0.41211849, -0.54402111, -0.99999021],
       [-0.53657292,  0.42016704,  0.99060736,  0.65028784],
       [-0.28790332, -0.96139749, -0.75098725,  0.14987721]])
ind = data.argmax(axis=0)
ind
array([2, 0, 3, 1])
time_max = time[ind]
time_max
array([ 82.5 , 20. , 113.75, 51.25])
data_max = data[ind,range(data.shape[1])]
data_max
array([0.98935825, 0.84147098, 0.99060736, 0.6569866 ])
np.all(data_max == data.max(axis=0))
True
a = np.arange(5)
a
array([0, 1, 2, 3, 4])
a[[1,3]] = 0
a
array([0, 0, 2, 0, 4])
a = np.arange(5)
a[[0,0,2]] == [1,2,3]
a
array([0, 1, 2, 3, 4])
a = np.arange(5)
a+= 1
a
array([1, 2, 3, 4, 5])
使用布尔数组索引
a = np.arange(12).reshape(3, 4)
b = a > 4
b
array([[False, False, False, False],
       [False,  True,  True,  True],
       [ True,  True,  True,  True]])
a[b]
array([ 5, 6, 7, 8, 9, 10, 11])
a[b] = 0
a
array([[0, 1, 2, 3],
       [4, 0, 0, 0],
       [0, 0, 0, 0]])
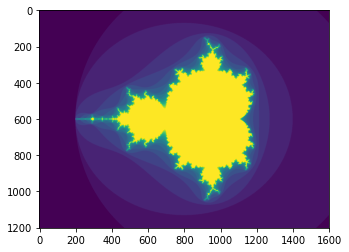
# 使用布尔索引生成Mandelbrot 集的图像
def mandelbrot(h,w,maxit=20,r=2):
    x = np.linspace(-2.5, 1.5, 4*h+1)
    y = np.linspace(-1.5, 1.5, 3*w+1)
    A, B = np.meshgrid(x, y)
    C = A + B*1j
    z = np.zeros_like(C)
    divtime = maxit + np.zeros(z.shape, dtype=int)

    for i in range(maxit):
        z = z**2 + C
        diverge = abs(z) > r                    # who is diverging
        div_now = diverge & (divtime == maxit)  # who is diverging now
        divtime[div_now] = i                    # note when
        z[diverge] = r                          # avoid diverging too much

    return divtime

plt.imshow(mandelbrot(400,400))
<matplotlib.image.AxesImage at 0x7f0b852ed130>

# 使用布尔值进行索引的第二种方式更类似于整数索引;对于数组的每个维度,我们给出一个一维布尔数组,选择我们想要的切片:

a = np.arange(12).reshape(3,4)
b1 = np.array([False, True, True])
b2 = np.array([True, False, True, False])
a[b1,:]
array([[ 4,  5,  6,  7],
       [ 8,  9, 10, 11]])
a[b1]
array([[ 4,  5,  6,  7],
       [ 8,  9, 10, 11]])
a[:,b2]
array([[ 0,  2],
       [ 4,  6],
       [ 8, 10]])
a[b1,b2]
array([ 4, 10])
向量堆叠
我们如何从一个大小相等的行向量列表构造一个二维数组?在 MATLAB 中,这很容易:如果x和y是两个长度相同的向量,您只需要 do m=[x;y]。在此NumPy的通过功能的工作原理column_stack,dstack,hstack和vstack,视维在堆叠是必须要做的。例如:
x = np.arange(0,10,2)
y = np.arange(5)
m = np.vstack([x,y])
m
array([[0, 2, 4, 6, 8],
       [0, 1, 2, 3, 4]])
xy = np.hstack([x,y])
xy
array([0, 2, 4, 6, 8, 0, 1, 2, 3, 4])
Histograms
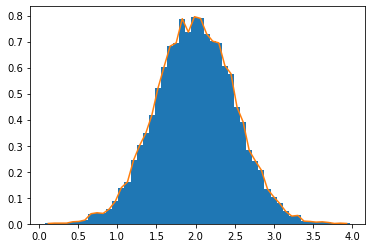
histogram应用于数组的 NumPy函数返回一对向量:数组的直方图和 bin 边缘的向量。注意: matplotlib还有一个函数来构建hist与 NumPy 中的直方图不同的直方图(在 Matlab 中称为)。主要区别在于pylab.hist自动绘制直方图,而 numpy.histogram只生成数据。
import numpy as np
rg = np.random.default_rng(1)
import matplotlib.pyplot as plt
# Build a vector of 10000 normal deviates with variance 0.5^2 and mean 2
mu, sigma = 2, 0.5
v = rg.normal(mu, sigma, 10000)
# Plot a normalized histogram with 50 bins
plt.hist(v, bins=50, density=True)       # matplotlib version (plot)
# Compute the histogram with numpy and then plot it
(n, bins) = np.histogram(v, bins=50, density=True)  # NumPy version (no plot)
plt.plot(.5 * (bins[1:] + bins[:-1]), n)
[<matplotlib.lines.Line2D at 0x7f0b85243be0>]
